Press Releases

74.2% of paying users are aware of the "New Smartphone Law"!
[2026 Edition] Results of a survey on smartphone game app usage and billing trends released.
~PayPay is the most desired payment method; the reason for choosing in-app purchases is "the payment service you want to use" rather than discounts or benefits~

July 28, 2026

SB Payment Service Corp.

SB Payment Service Corp. (Minato-ku, Tokyo; President & CISO: Tomonori Hotta), a subsidiary of SoftBank Corp., conducted a survey on smartphone game app usage and billing habits among men and women who regularly play smartphone game apps. The results are summarized below.


Survey Overview

Survey Name
Survey on smartphone game app usage and billing status
Survey method
Internet research
Study area
Nationwide
Survey period
February 18th - March 6th, 2026
Survey participants
1,659 men and women who regularly play smartphone game apps
Implementing body
SB Payment Service Corp.

Summary of research findings

Playing tendencies

  • 52.0% of respondents reported spending an average of one hour or more per day playing smartphone game apps. Men in their teens to thirties and women in their twenties and forties tend to play for longer periods.

Billing Status

  • The percentage of paying users is 44.1%. By age group, the percentage of men and women in their 20s who spend between 1,000 and 5,000 yen, and the percentage of men in their 20s and 30s who spend between 5,000 and 10,000 yen, are higher than other age groups.
  • Compared to the previous year, the percentage of paying users increased by 8.9%. In particular, the number of light spenders (those spending less than 5,000 yen) increased, while the number of non-paying users among women in their 40s decreased by 19.5%.

Awareness of the new smartphone law

  • Overall awareness is 46.9%, but among paying users it rises to 74.2%, and among heavy spenders who spend more than 30,000 yen per month, awareness is extremely high at 94.8%.

Usage status and future intentions regarding in-app purchases.

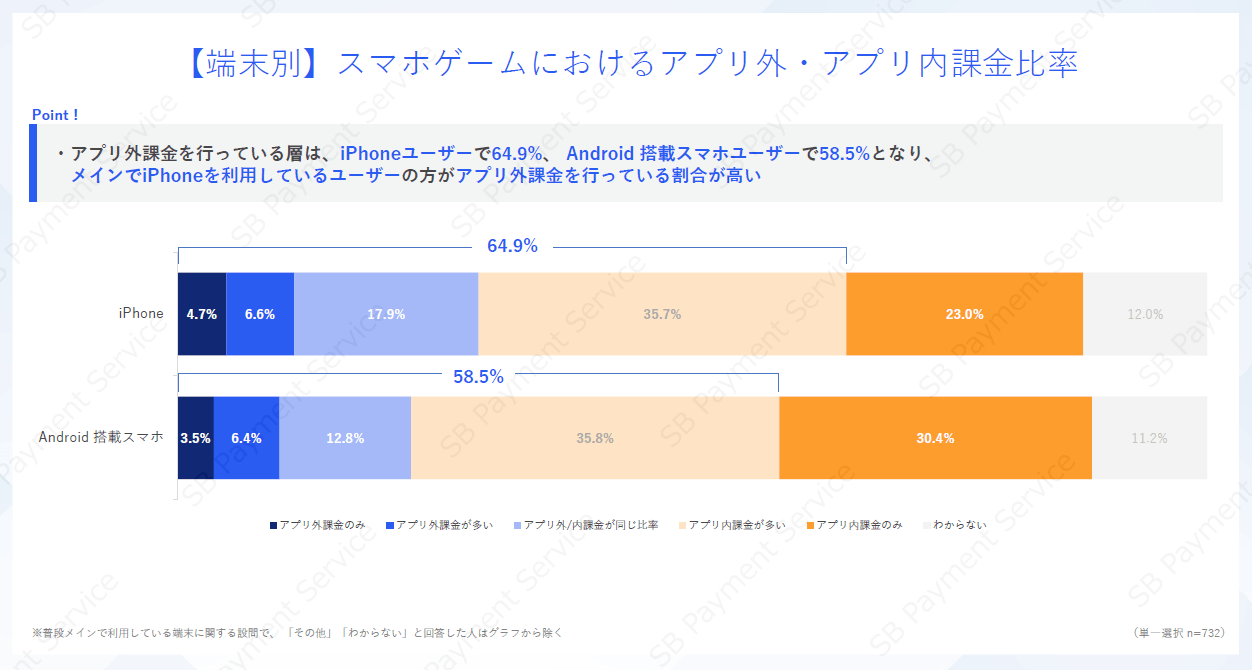
  • Among paying users, 62.1% make in-app purchases. Broken down by device, iPhone users (64.9%) are slightly more likely to utilize in-app purchases than Android smartphone users (58.5%).
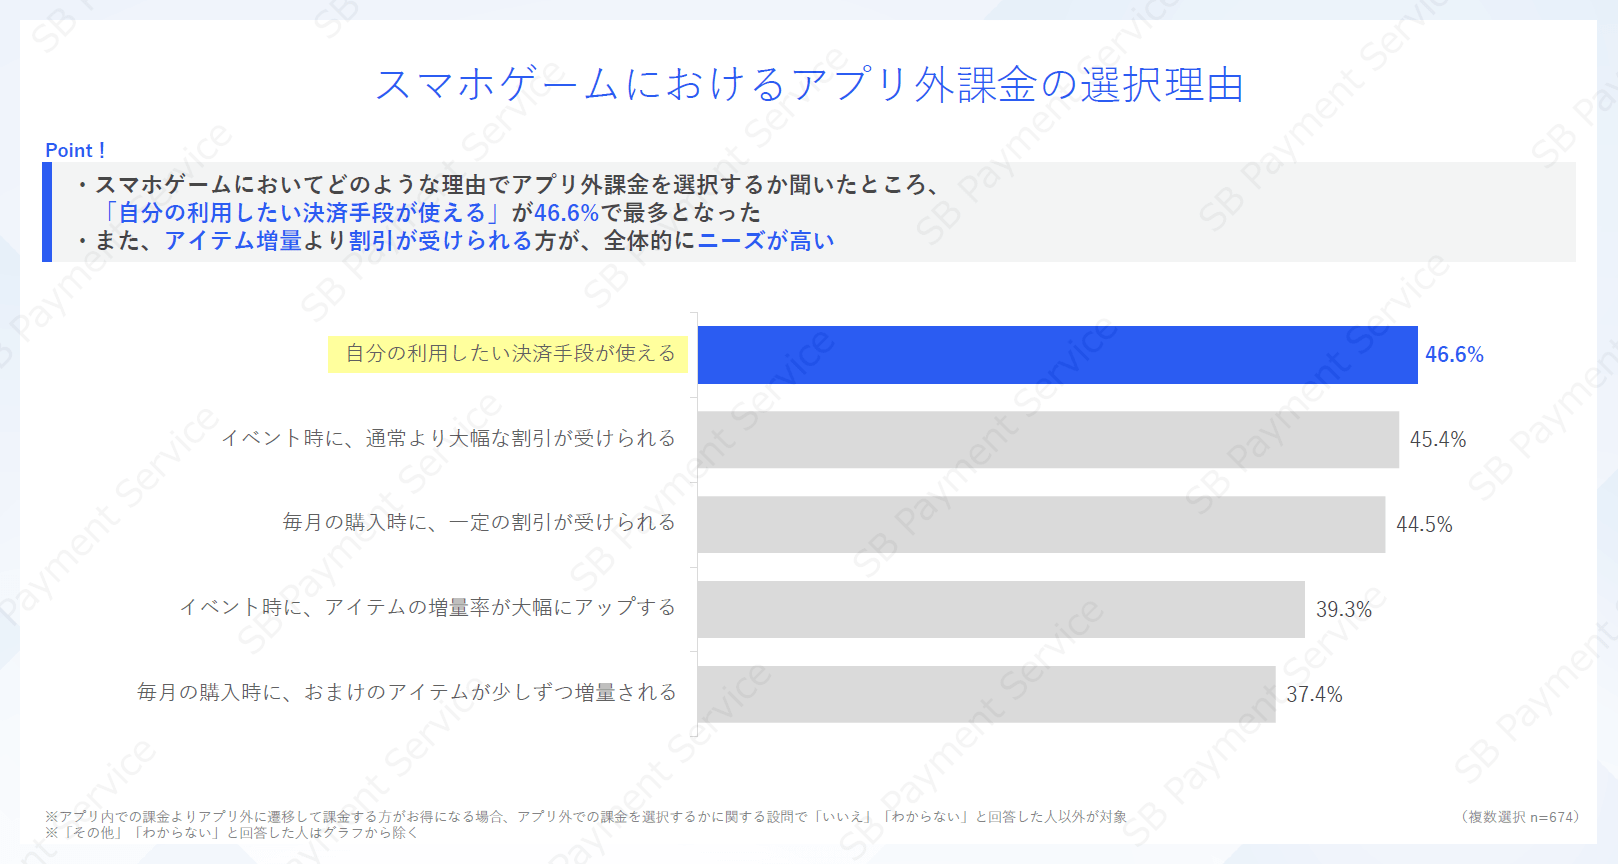
  • When choosing to make in-app purchases, the most common reason cited by 46.6% of users was "being able to use their preferred payment methods," rather than benefits such as increased item quantities or discounts.
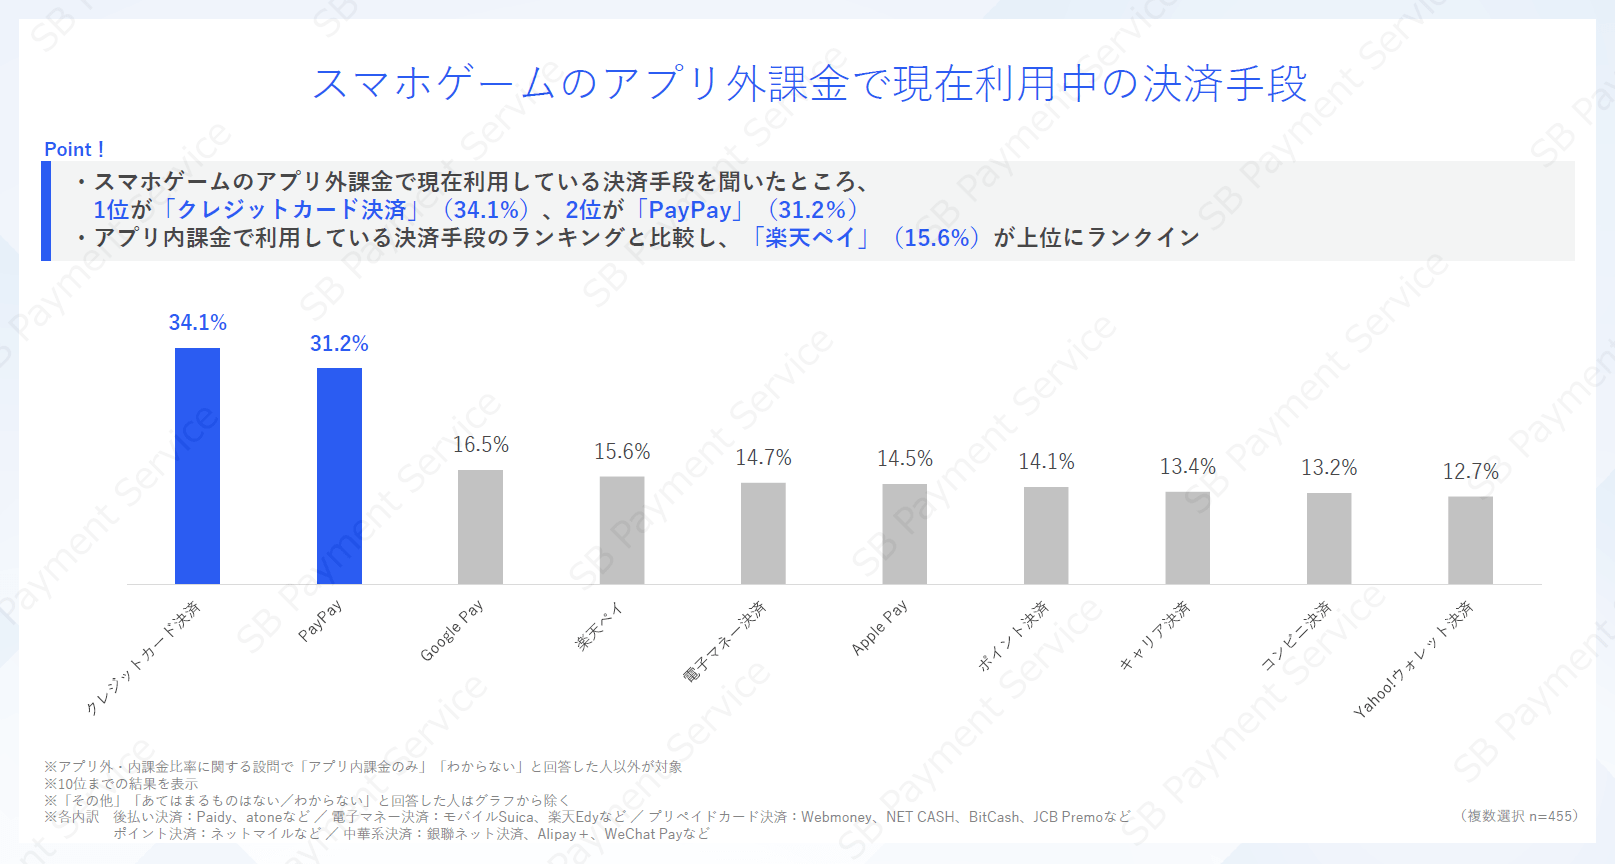
  • The most frequently used payment methods for in-app purchases are "Credit Card Payment" (34.1%) and "PayPay" (31.2%), compared to other payment methods
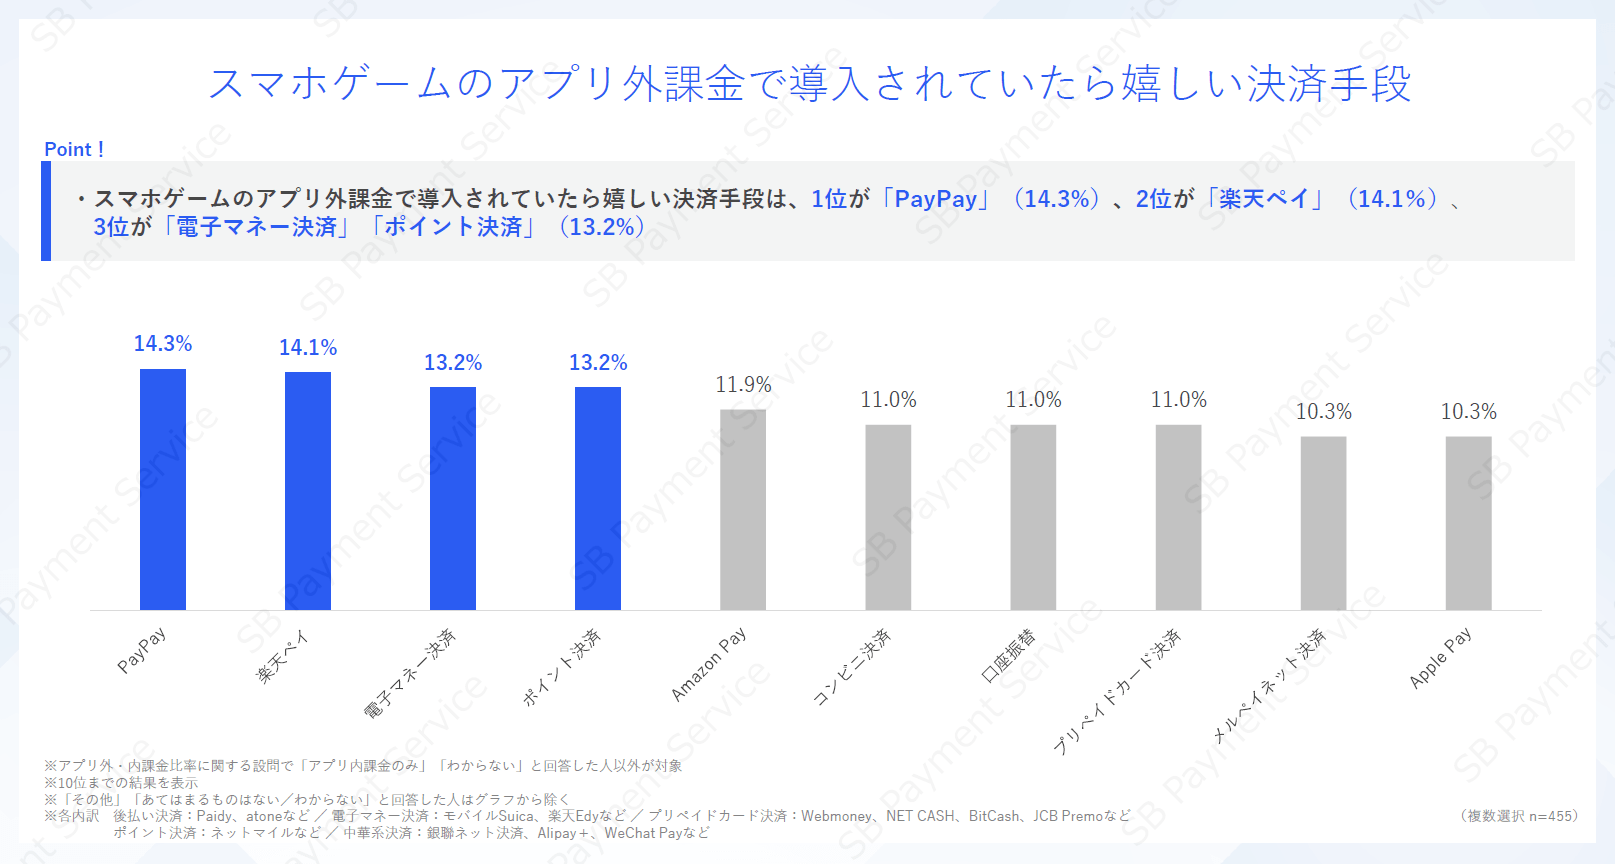
  • The most popular payment methods for in-app purchases are, in order: PayPay (14.3%), Rakuten Pay (14.1%), and electronic money/point payments (13.2% each).

Survey results

User Play Trends

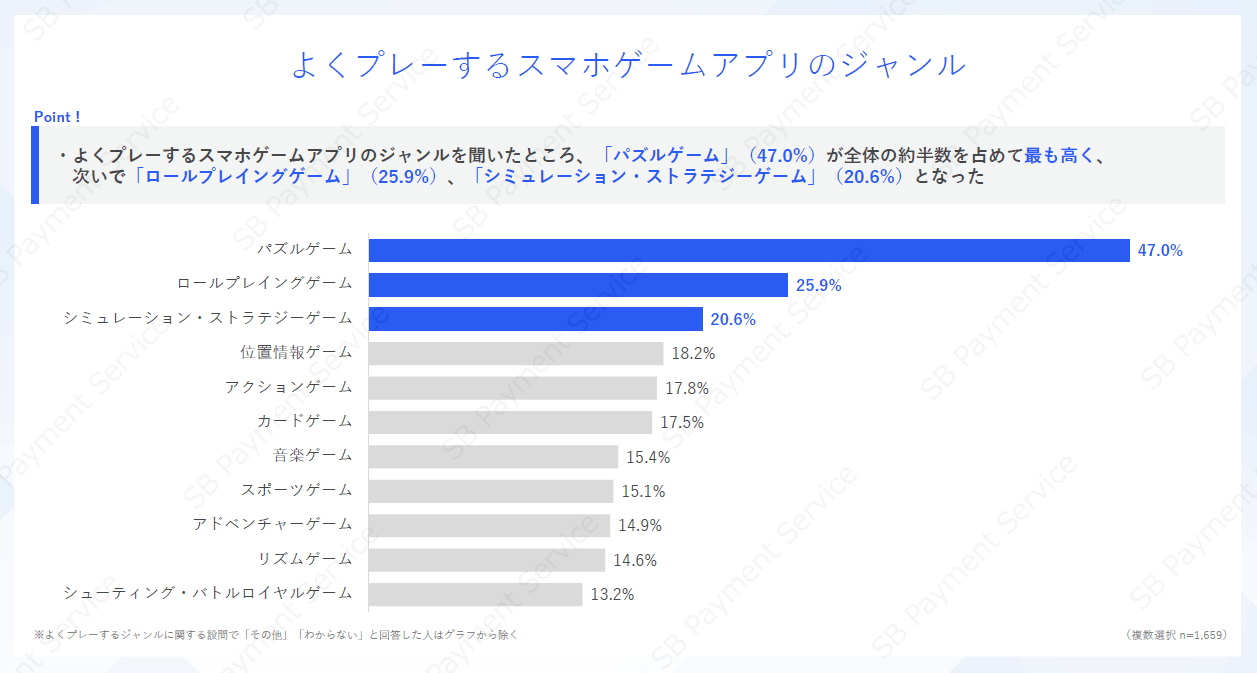
When men and women who regularly play smartphone games were asked about the genres of smartphone game apps they frequently play, "puzzle games" (47.0%) was the most popular, accounting for about half of the total. This was followed by "role-playing games" at 25.9% and "simulation/strategy games" at 20.6%.

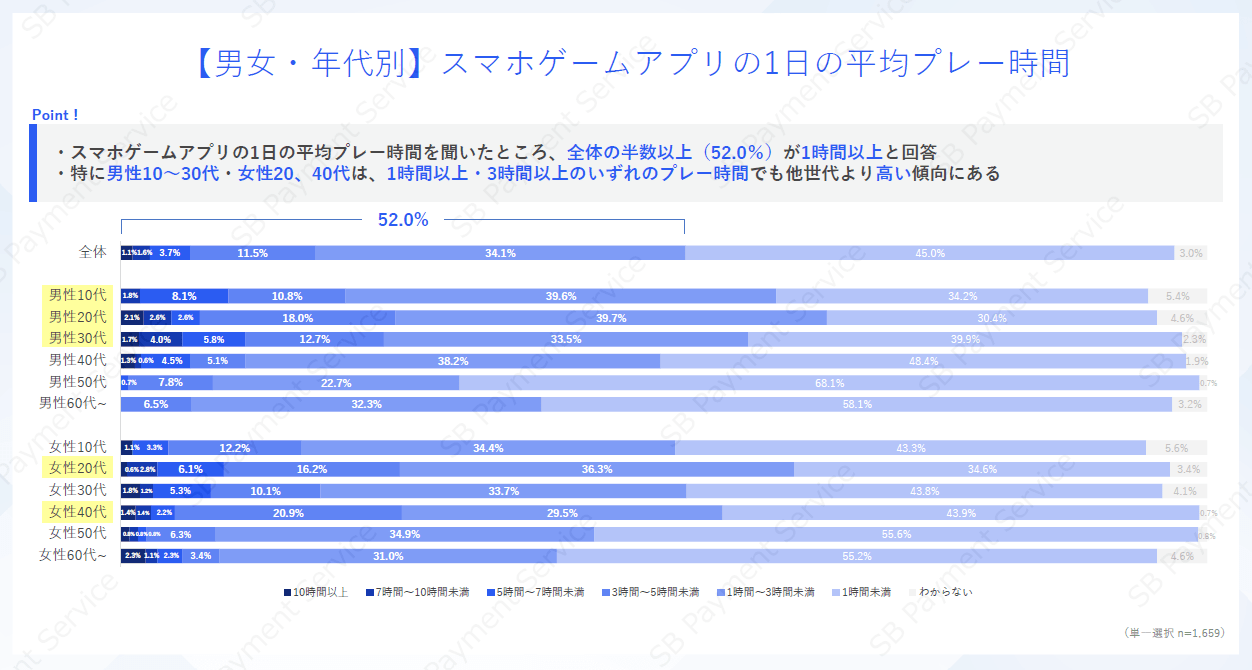
When we asked men and women who regularly play smartphone games how much time they spend playing smartphone game apps on average per day, 52.0% of respondents answered that they spend more than one hour. Broken down by age group, the percentage was higher among men in their teens to 30s and women in their 20s and 40s.
Furthermore, the proportion of people spending more than 3 hours playing games was higher among men in their teens to 30s and women in their 20s and 40s, indicating that approximately one in four or five people spend more than 3 hours a day playing games.


Information gathering media used by users

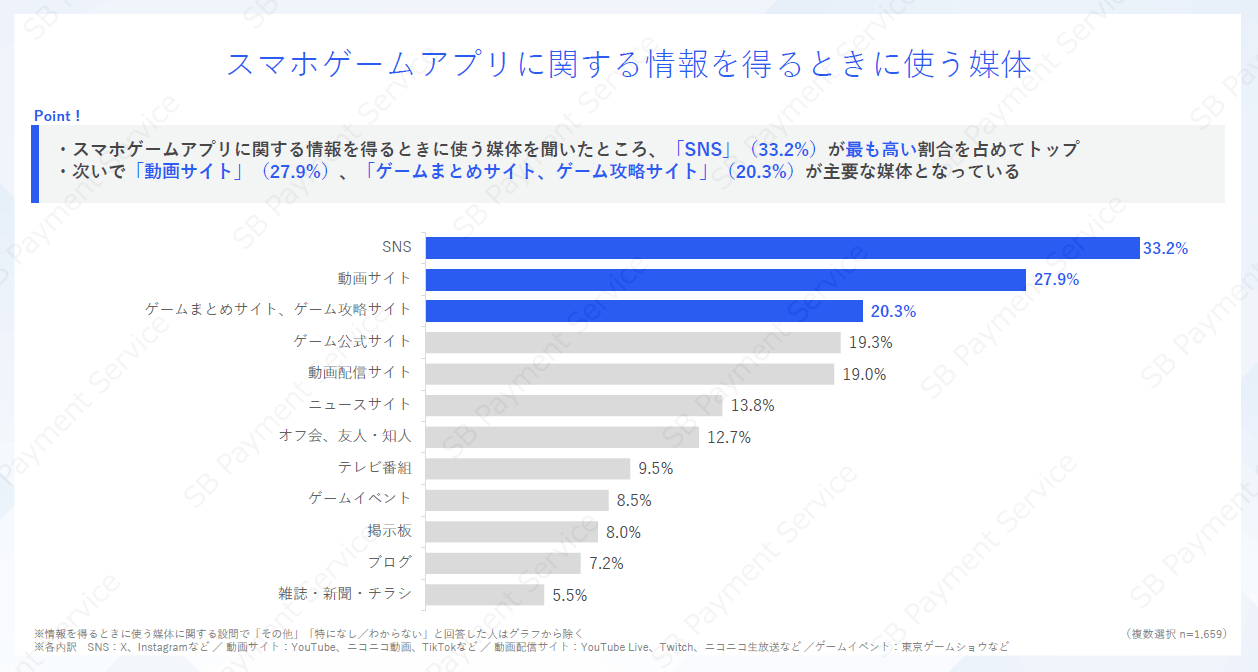
When men and women who regularly play smartphone games were asked about the media they use to obtain information about smartphone game apps, "SNS" (33.2%) was the most common answer. This was followed by "video sites" (27.9%) and "game summary sites, game strategy sites" (20.3%), indicating that information gathering is mainly centered around SNS and videos.


ユーザーの課金実態

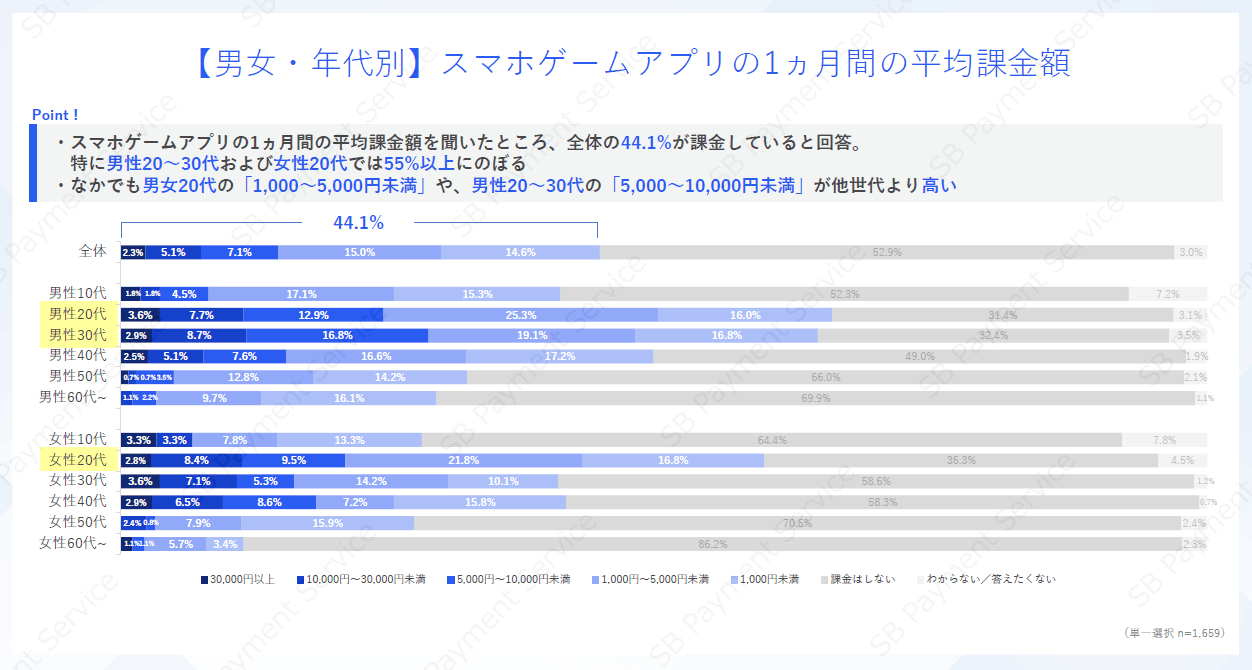
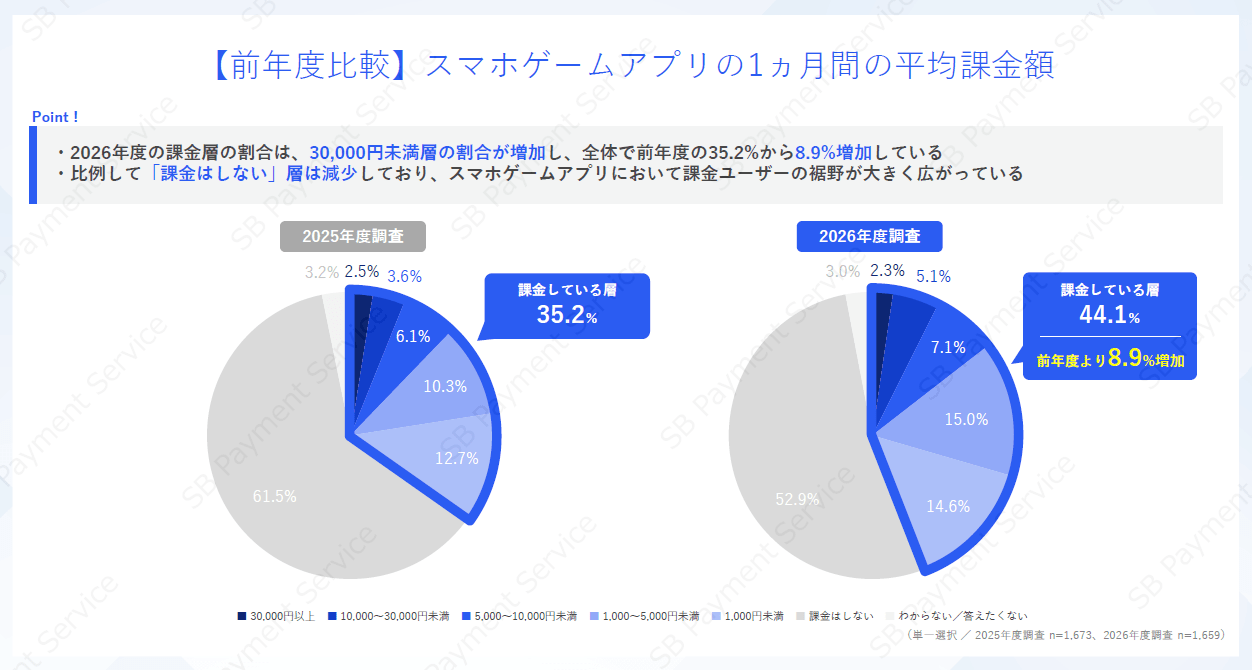
When we asked men and women who regularly play smartphone games how much they spend on smartphone game apps on average per month, 44.1% of the total said they do spend money on in-game purchases. In particular, the percentage of men and women in their 20s who spend "less than 1,000 to 5,000 yen," and men in their 20s and 30s who spend "less than 5,000 to 10,000 yen," was higher than in other age groups.

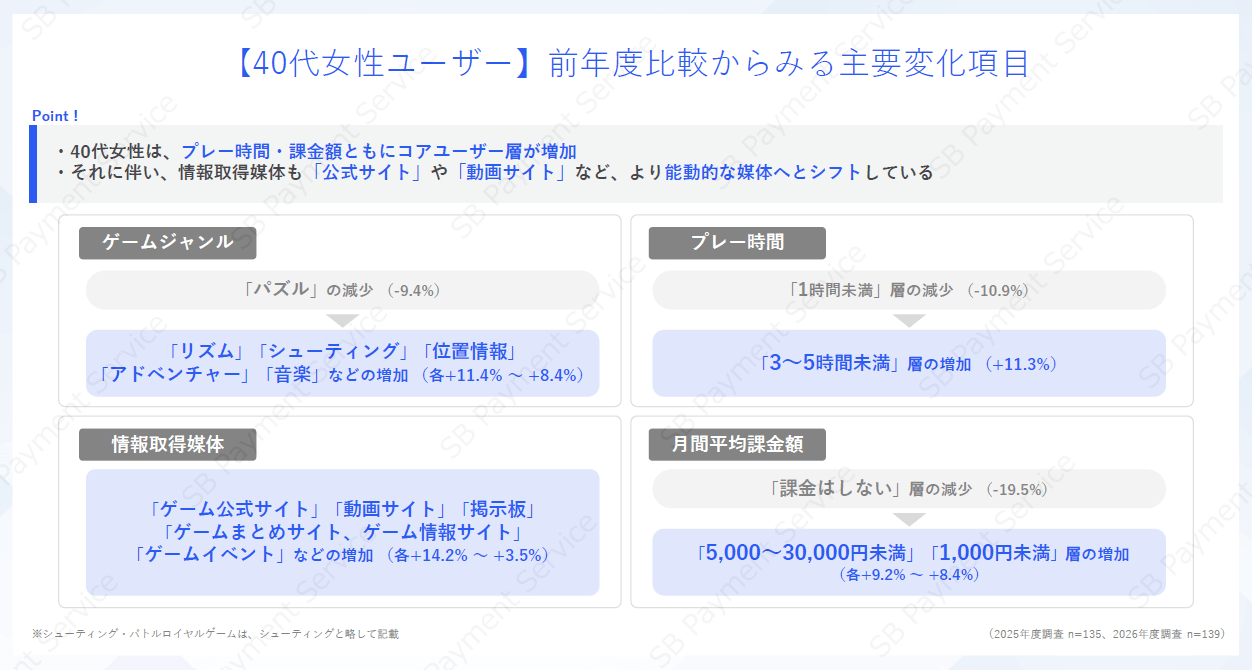
Furthermore, compared to the results of the same survey conducted in fiscal year 2025, the proportion of paying users increased by 8.9%, with a particularly noticeable increase in the "light" paying group (those spending less than 5,000 yen). Broken down by gender and age group, the increase was especially pronounced among women in their 40s, while the non-paying group decreased by 19.5%, suggesting a shift towards price ranges of less than 1,000 yen and between 5,000 and 30,000 yen.

User awareness of the new smartphone law

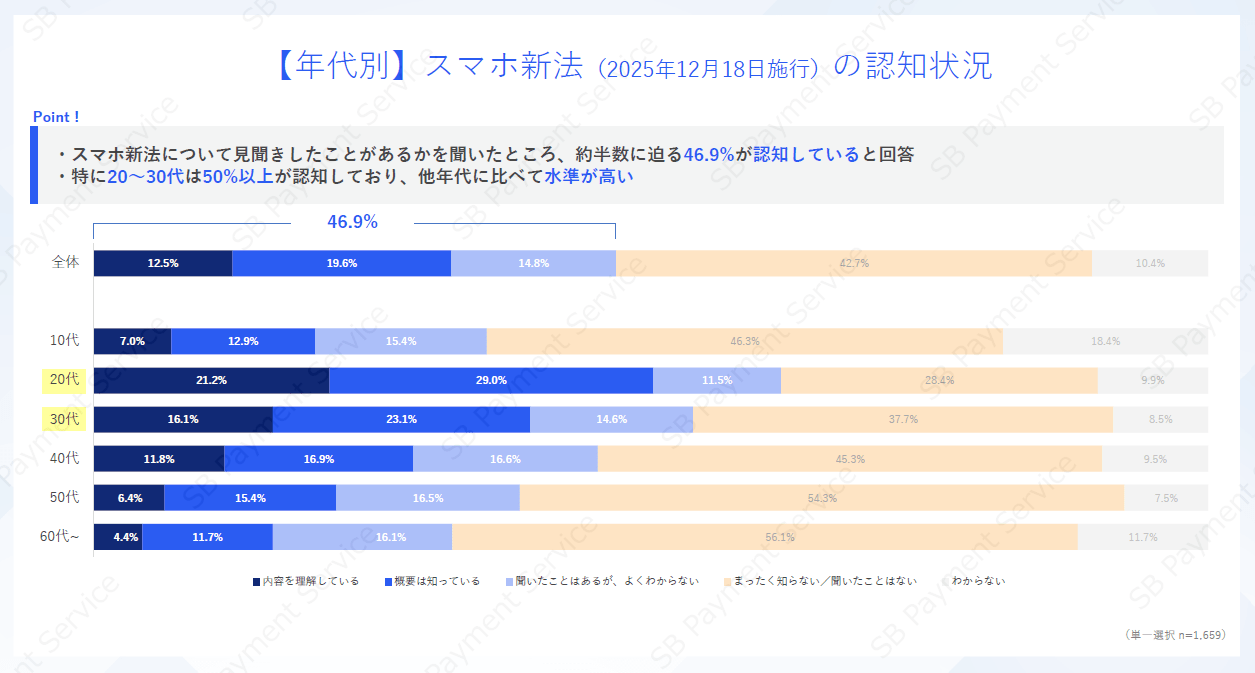
When we asked men and women who regularly play smartphone games if they had heard of the "Smartphone Software Competition Promotion Act (commonly known as the Smartphone New Law *)" which came into effect on December 18, 2025, 46.9% of respondents said they were aware of it. In particular, over 50% of those in their 20s and 30s were aware of it, a higher result compared to other generations.

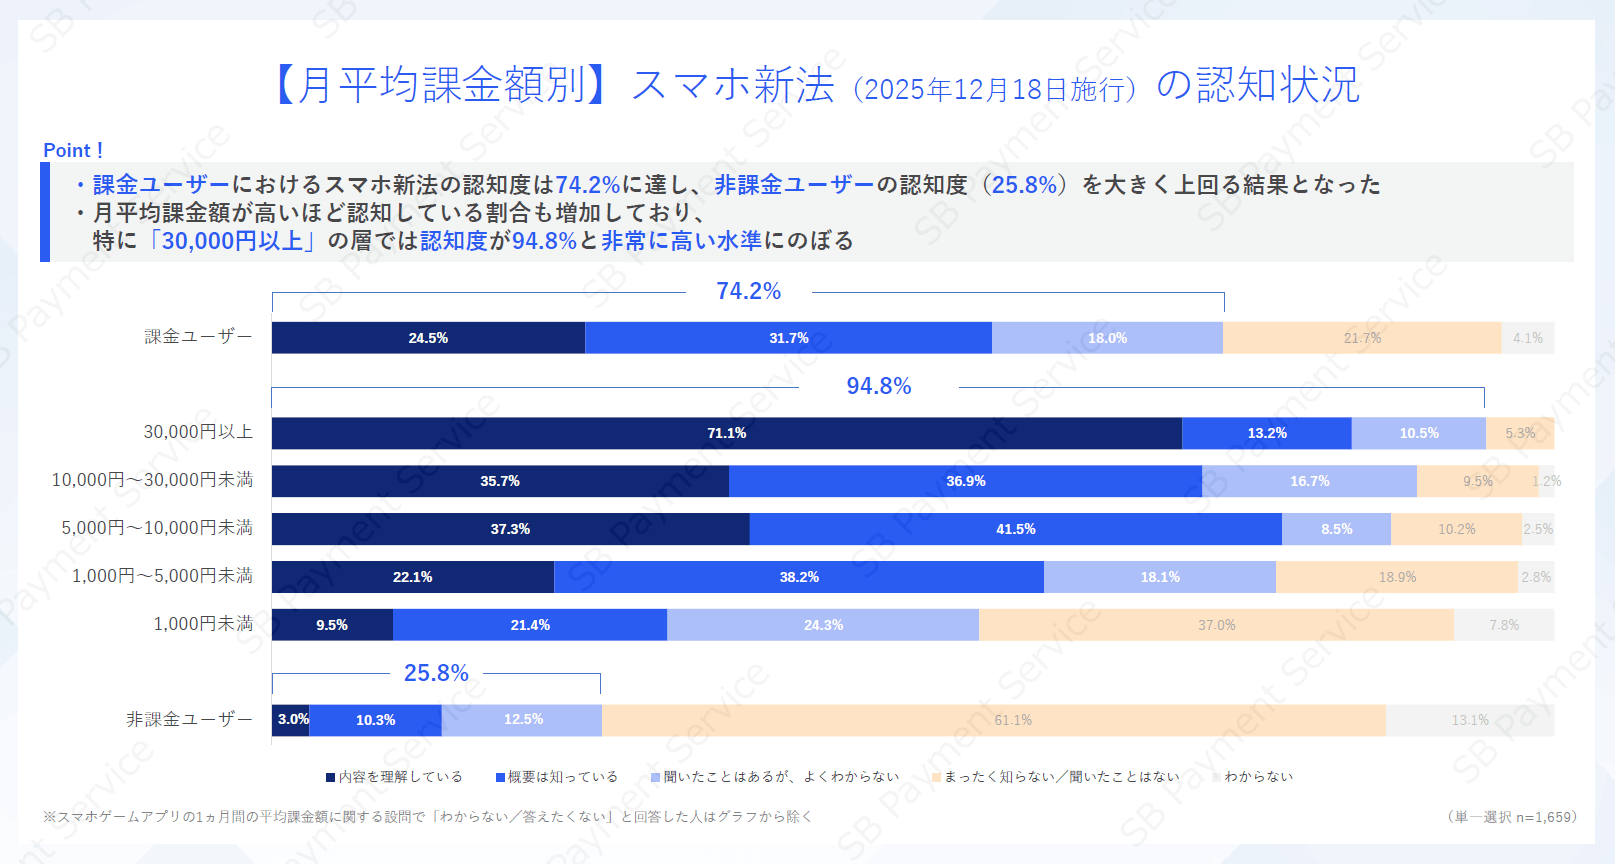
Furthermore, when comparing users based on whether they pay for services, the awareness rate of the new smartphone law among paying users reached 74.2%, significantly higher than that of non-paying users (25.8%). In addition, the awareness rate increased with higher average monthly spending, with the awareness rate being particularly high at 94.8% among those spending "30,000 yen or more."

User usage and future intentions regarding in-app purchases

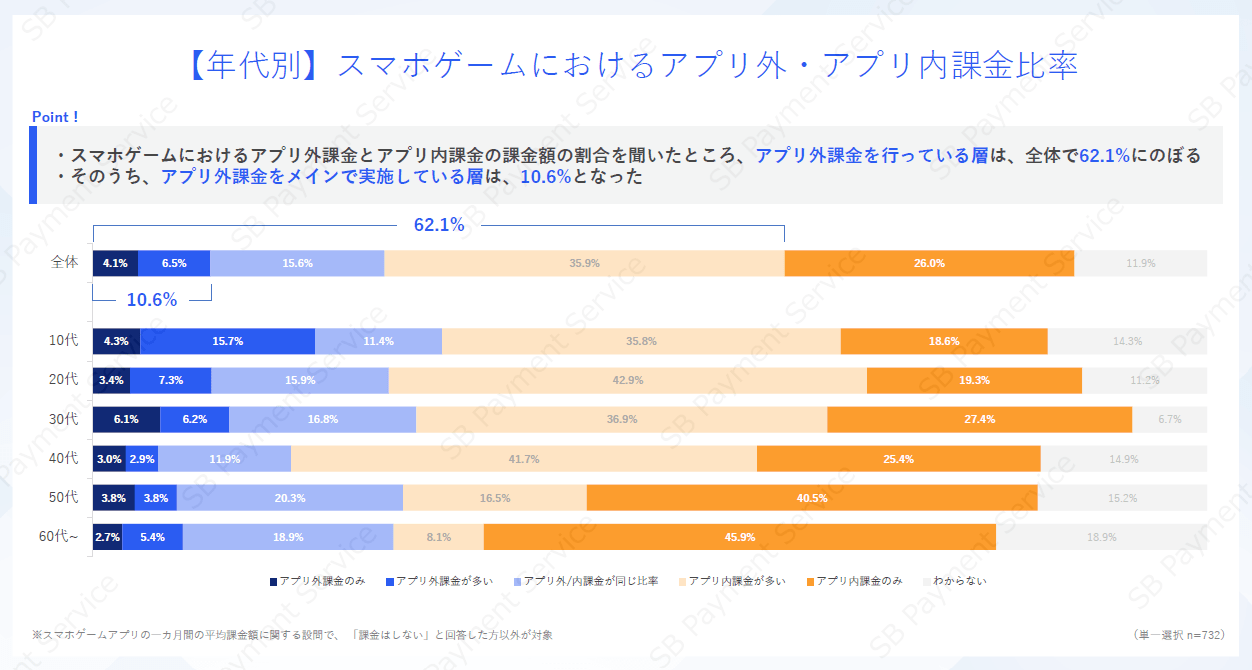
When we asked people who regularly make in-app purchases in smartphone games about the ratio of their spending on in-app purchases versus out-of-app purchases, 62.1% of the total said they make out-of-app purchases, and of those, 10.6% said they primarily make out-of-app purchases.

Furthermore, when comparing by the main device used, the percentage of users making in-app purchases was 64.9% for iPhone users and 58.5% for Android smartphone users, indicating that iPhone users are slightly more likely to make in-app purchases.

When asked why they choose to make in-app purchases, the most common answer was "I can use my preferred payment methods," at 46.6%. Furthermore, among the various benefits offered, there was a generally higher demand for discounts than for increased item quantities.

When we asked men and women who regularly play smartphone games about payment methods they currently use for in-app purchases and in-app purchases within smartphone apps, "Credit Card Payment" (34.1%) and "PayPay" (31.2%) were the top choices, both in the 30% range.

When we asked men and women who regularly play smartphone games which payment methods they would like to see introduced for in-app purchases, "PayPay" came in first place (14.3%), followed by "Rakuten Pay" (14.1%), and "Electronic money" and "point payment" (13.2% each).
As mentioned above, the ability to use payment methods of one's choice is key to selecting in-app purchases, so expanding payment methods to meet user needs is extremely important for promoting future usage.

SB Payment Service Corp. offers a variety of payment services for businesses that sell smartphone game apps and other similar products. As a SoftBank group company, we can leverage SoftBank's customer base to support brand awareness and customer acquisition, as well as offer a wide range of payment methods tailored to user needs. Please feel free to contact SB Payment Service Corp.


You can download the full survey results here.
https://service.sbpayment.jp/whitepapers/download/mobilegame/

Copyright

  • You are free to reproduce both the diagrams and text from this survey.
  • The copyright for this survey belongs to SB Payment Service Corp., but permission to use it is granted to those who meet the following terms of use.

Terms of use

  1. The source of the information will be clearly stated as "SB Payment Service Corp."
  2. The following URL will be provided as the source.
    https://www.sbpayment.jp/news/press/2026/20260728_001579/
  3. The survey results data will be used without any processing or modification.
  4. If we determine that the content is inappropriate, we will comply with any request to remove it.
  • Android and other marks are trademarks of Google LLC.
  • iPhone is a trademark of Apple Inc., registered in the U.S. and other countries. ™ and © 2024 Apple Inc. All rights reserved.
  • The iPhone trademark is used under license from Aiphone Co., Ltd.
  • Other company names and product/service names mentioned are trademarks or registered trademarks of the respective companies.

Company Profile

SB Payment Service Corp.

Representative Tomonori Hotta, President & CISO
Location 1-7-1 Kaigan, Minato-ku, Tokyo Tokyo Port City Takeshiba Office Tower
Established October 1, 2004
Business content Payment service, collection agency and corporate calculation office work, acquiring (card merchant business) business, issuing (card issuing business) business
URL https://www.sbpayment.jp/en/gl-top/

Inquiries about payment services

SB Payment Service Corp.

Inquiry form https://www.sbpayment.jp/en/contact/contact-en/

Inquiries from the media regarding this matter

SB Payment Service Corp. Public Relations

Inquiry form https://www.sbpayment.jp/en/contact/contact-en/