Press Releases
Heavy users are women in their 20s! Survey results released on
smartphone game app usage and in-app purchases
~25.4% of non-paying smartphone game app players intend to make in-app purchases. User trends revealed, including popular game genres, information gathering media, and spending amounts~
May 14, 2025
SB Payment Service Corp.
SB Payment Service Corp. a subsidiary of SoftBank Corp. (Head office: Minato-ku, Tokyo; President and CEO: Jun Shimba), conducted a survey on smartphone game apps among men and women who regularly play smartphone game apps. Below are excerpts from the results.
- Survey Name
- Survey on smartphone game app usage and billing status
- Survey method
- Internet research
- Study area
- Nationwide
- Survey period
- March 19th - April 9th, 2025
- Survey participants
- Men and women who regularly play smartphone game apps
- Implementing body
- SB Payment Service Corp.
[Playing trends]
- The most popular genre of smartphone game app is "puzzle games" among men and women of all ages.
- The average daily play time for smartphone games is over 1 hour for 50.7% of the total. Men in their teens to 30s and women in their teens to 20s tend to play for longer periods of time.
- When asked when they would like to play, 49.0% answered "Whenever I have free time."
[Media used]
- The number one medium that triggers new downloads/purchases of smartphone game apps is "SNS" for those under 40, and "Internet advertising" for those over 50.
- When asked what sources they usually use to gather information about smartphone game apps, those in their teens to 40s chose "SNS" and "video sites," while those in their 50s and older chose "game summary/information sites."
- When it comes to gathering information on "SNS," "video sites," and "video distribution sites," the most popular media for both men and women is "YouTube," followed by "X," "TikTok" for men and "Instagram" for women.
[Charging status]
- The average monthly billing amount is higher for women in their 20s who spend between 5,000 and 10,000 yen, and over 30,000 yen, while the percentage of men in their 30s who spend between 10,000 and 30,000 yen is higher than other generations.
- People who gather information on live streaming/video sites such as "Kick," "Niconico Live Broadcast," "Twitch," "Niconico Video," and "YouTube Live" tend to spend more on them.
[Intention to make outside app purchases]
- 24.3% of the total population have made in-app purchases. This is especially true for those in their 20s (40.6%) and 30s (34.6%).
- 25.4% of people who do not normally pay for smartphone game apps have a positive intention to do so if they can purchase at a better price than in-app.
- The most popular payment methods for both men and women are "PayPay" and "Credit Card Payment"
<Survey results>
[User playing trends]
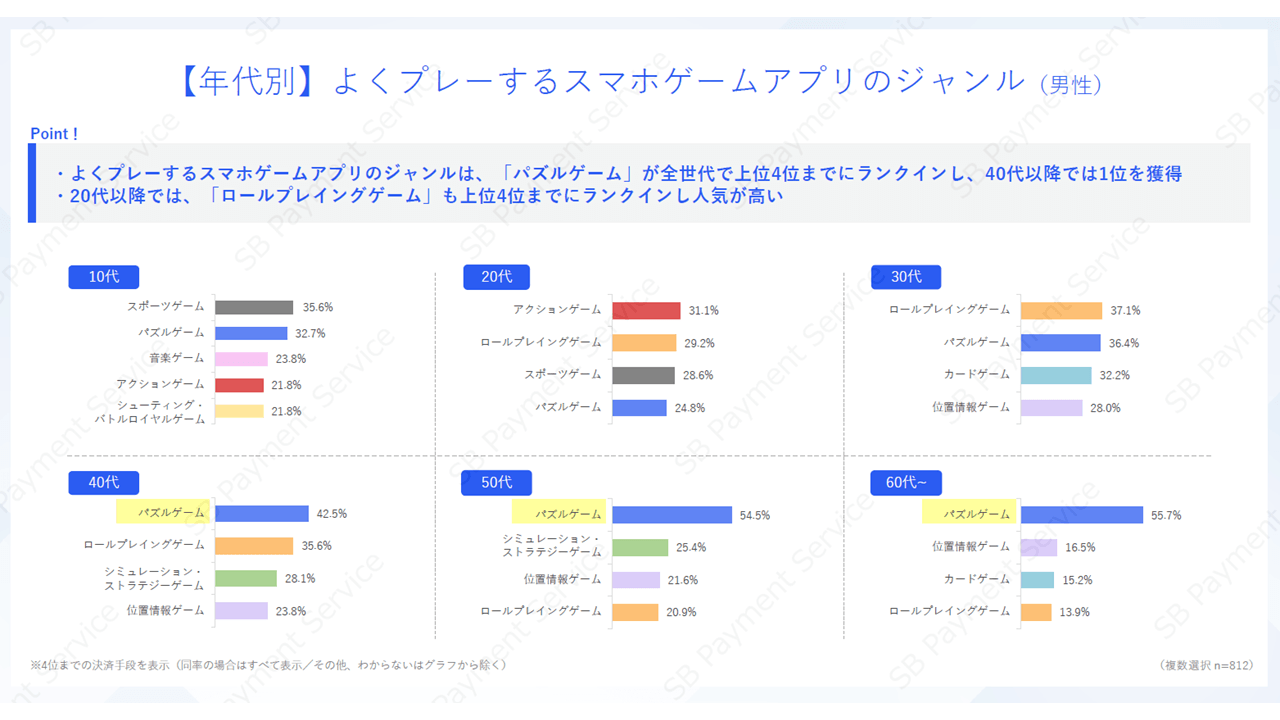
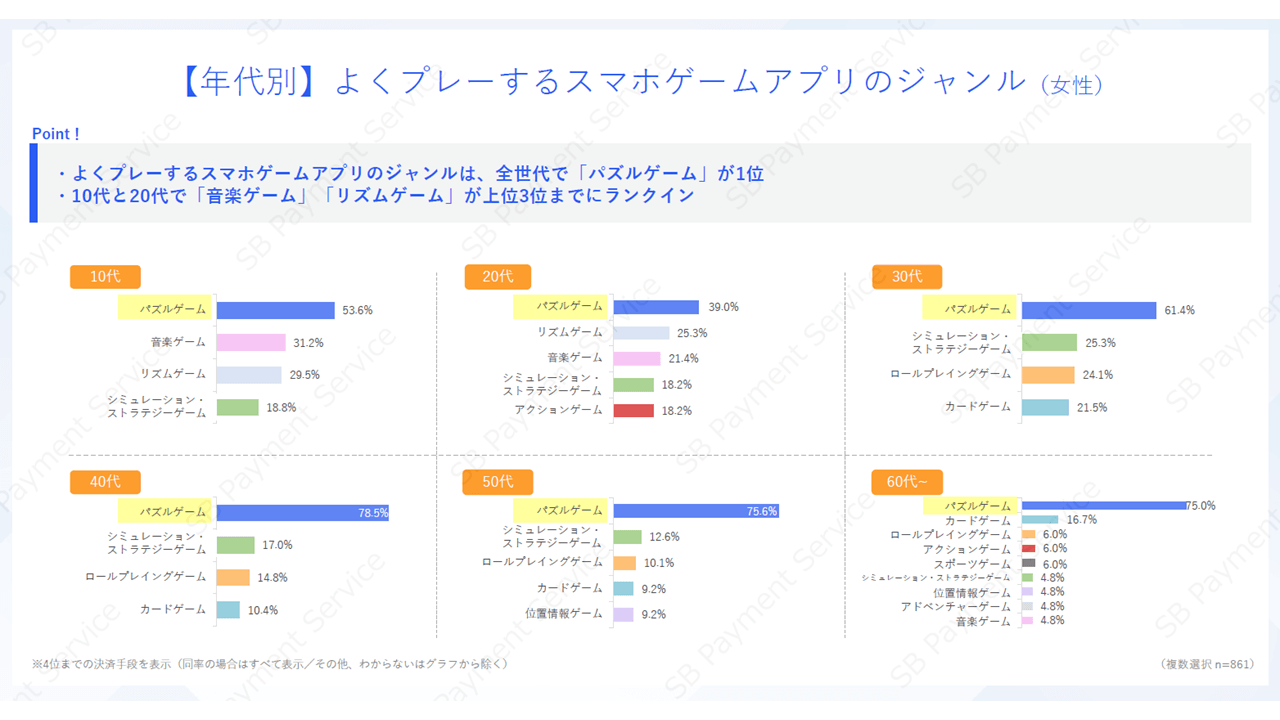
When asked about the genre of smartphone game apps they often play, "puzzle games" were popular with both men and women, with "puzzle games" coming in first among men in their 40s and older and women of all ages. Men in their 20s and older also chose "role-playing games," while women in their teens and 20s chose "music games" and "rhythm games."
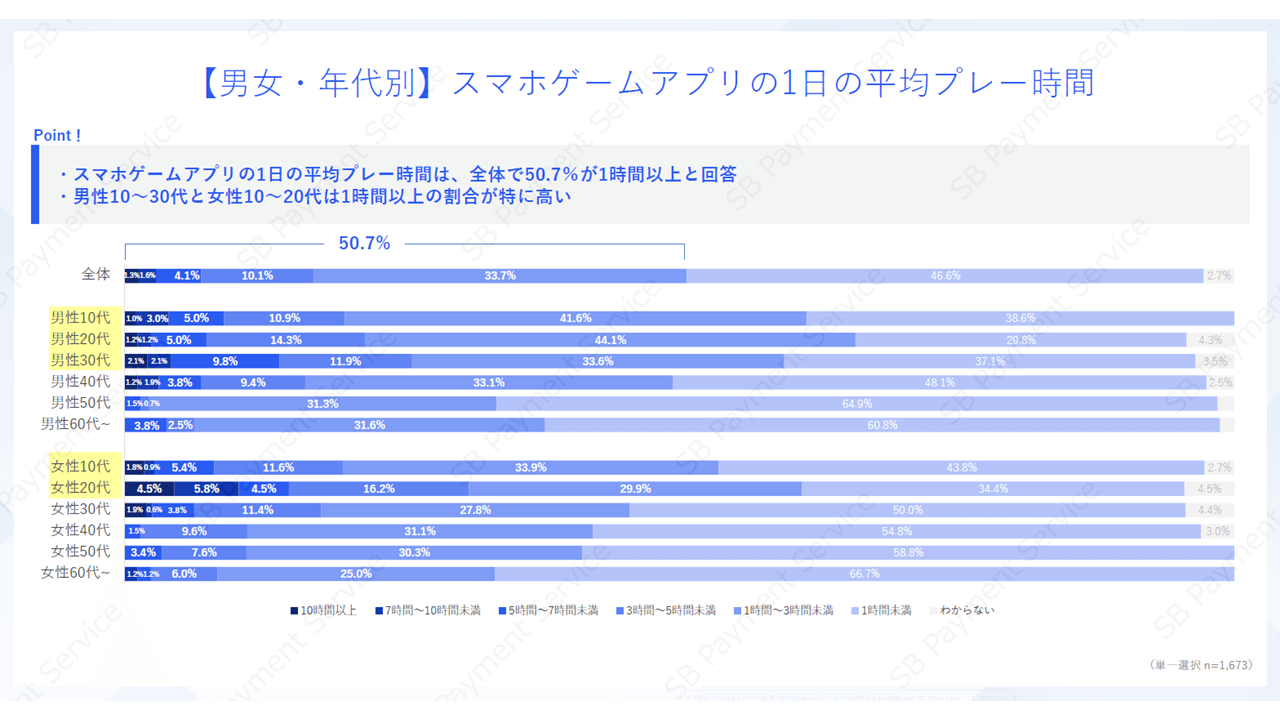
When asked how much time they spend playing smartphone games per day on average, 50.7% of respondents answered over 1 hour. Men in their teens to 30s and women in their teens to 20s tended to play for particularly long periods of time, with the proportion of men in their 30s who played for "5 to 7 hours" and women in their 20s who played for "7 to 10 hours" and "10 hours or more" being higher than other generations.
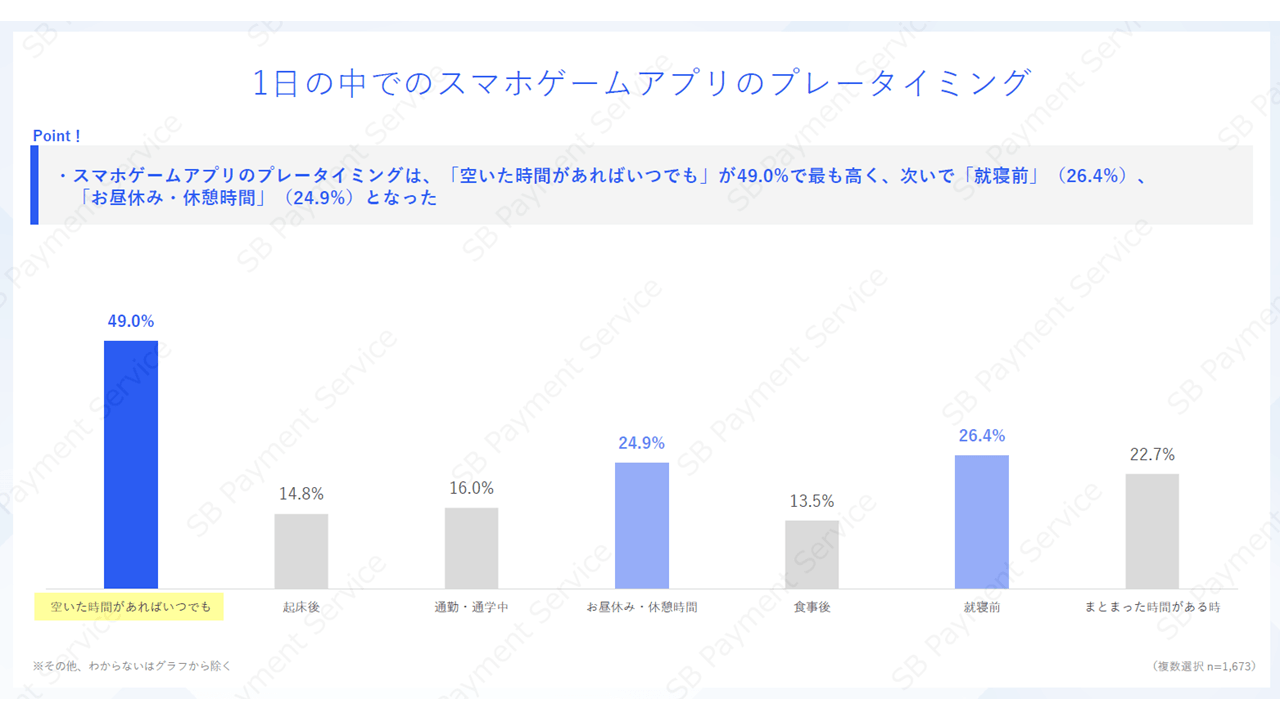
When asked when they usually play smartphone game apps, the most common answer was "Whenever I have free time" at 49.0%, followed by "Before going to bed" at 26.4% and "During lunch breaks/breaks" at 24.9%.
[Media used by users]
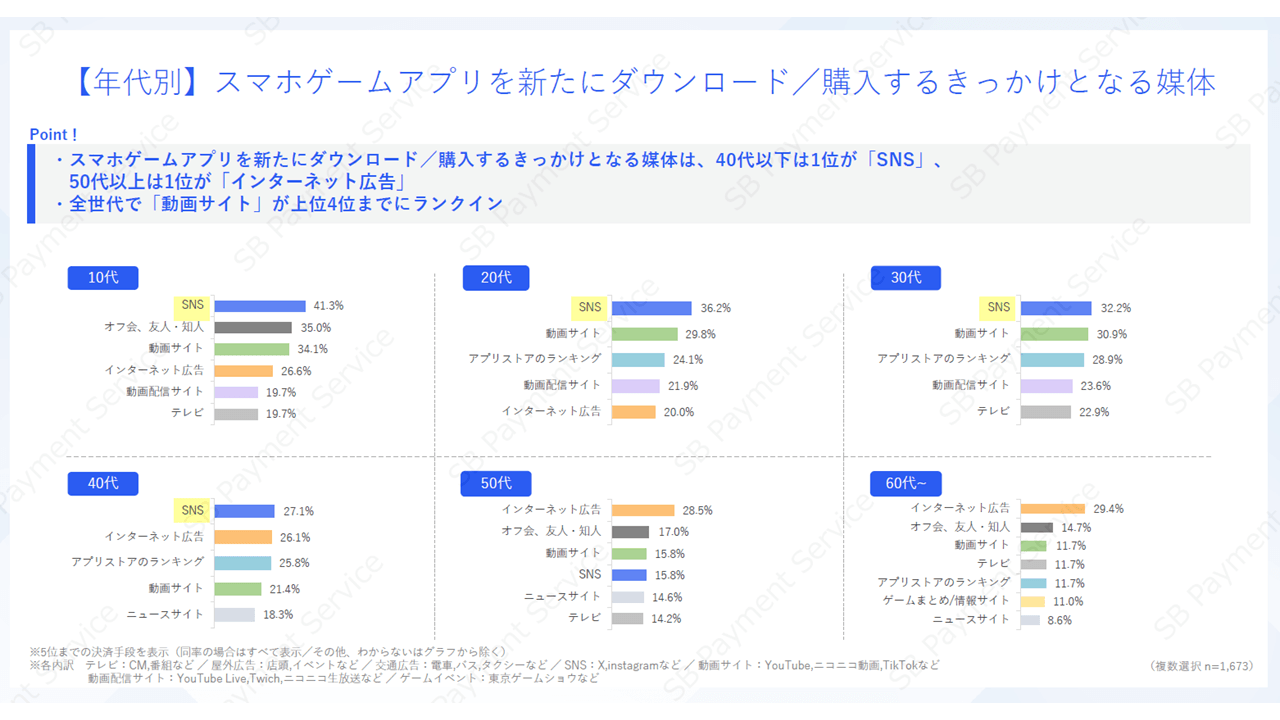
When asked what media would trigger a new download or purchase of a smartphone game app, the top answer was "SNS" for those under 40, and "Internet advertising" for those over 50. In addition, "video sites" were also chosen by all generations.
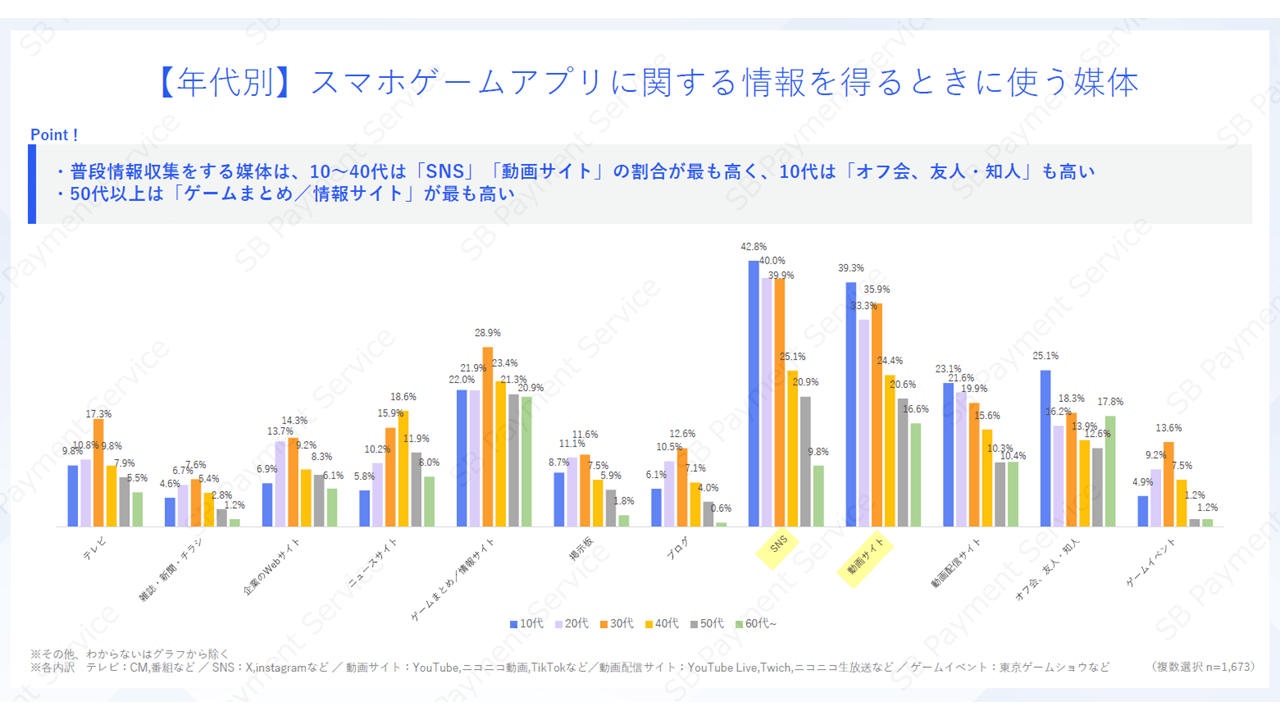
When asked what media they use to get information about smartphone game apps, those in their teens to 40s chose "SNS" and "video sites," while those in their 50s and older chose "game summary/information sites." Among teenagers, "offline meetups, friends and acquaintances" also accounted for a high proportion at 25.1%.
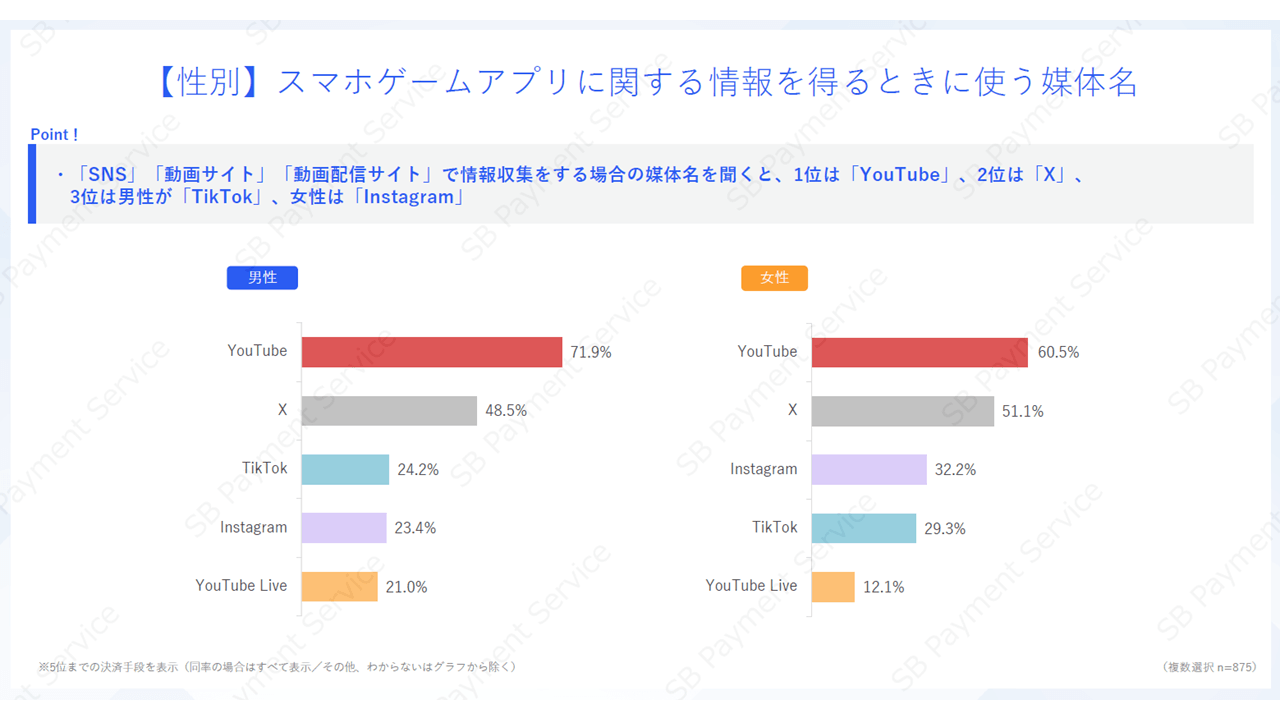
When we asked those who get information from "SNS," "video sites," and "video distribution sites" about the names of those media, the top choice for both men and women was "YouTube," followed by "X." In third place, men chose "TikTok," and women chose "Instagram."
[User billing status]
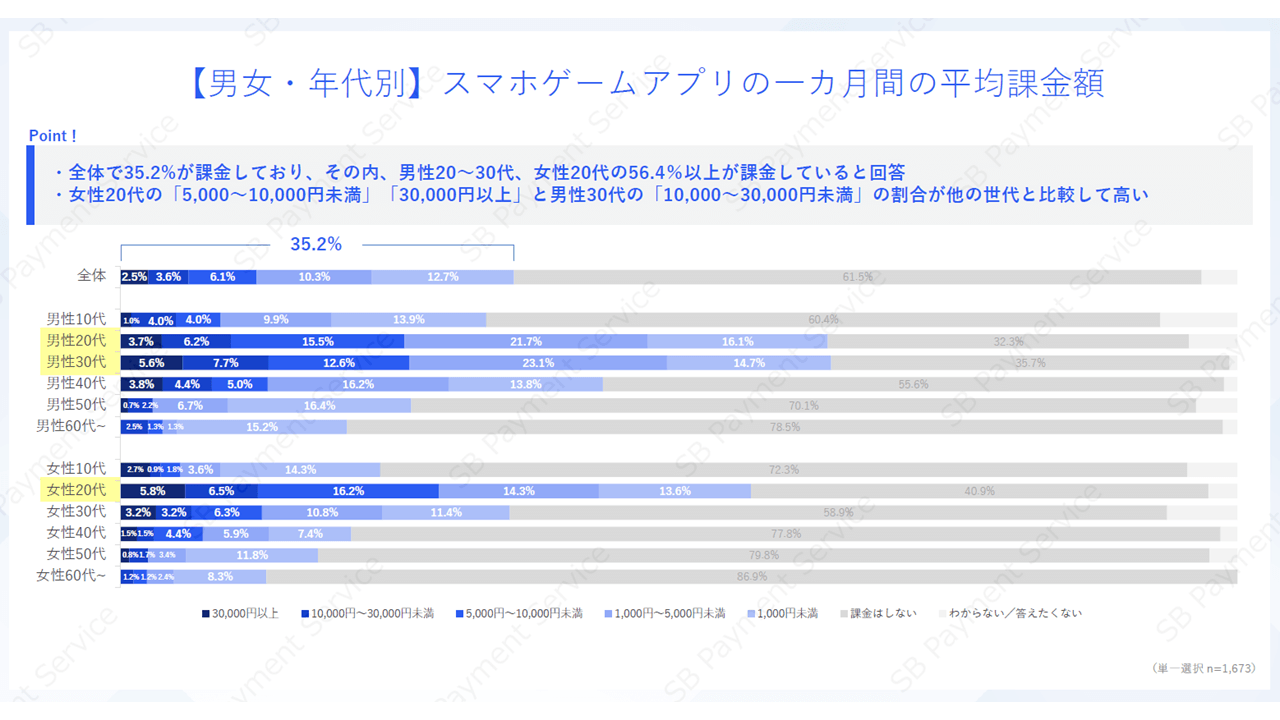
When asked how much they spend on average on smartphone game apps in a month, 35.2% of respondents said they do, with the proportions higher than other generations being "5,000 to less than 10,000 yen" (16.2%) for women in their 20s and "30,000 yen or more" (5.8%) and "10,000 to less than 30,000 yen" (7.7%) for men in their 30s.
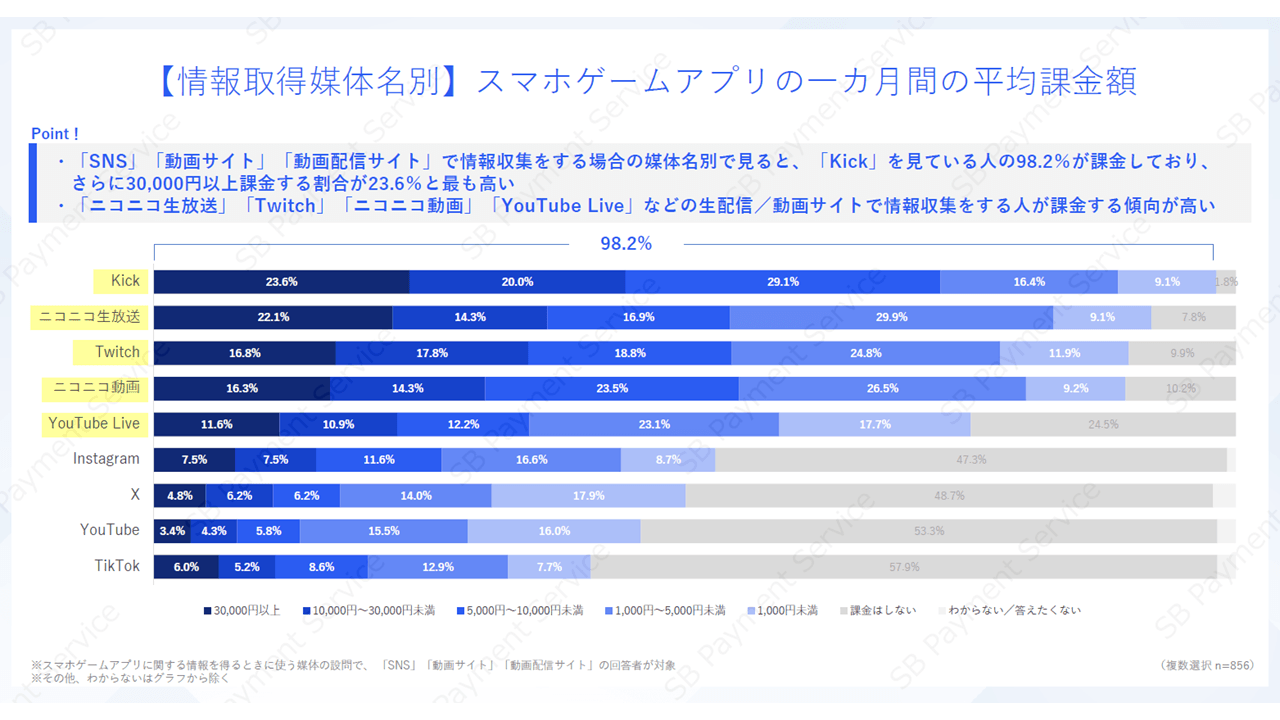
When we surveyed people who get information from "SNS," "video sites," and "video distribution sites" about the average monthly charges by the medium they use, 23.6% of people who use "Kick" spend over 30,000 yen a month, which was the highest result. We also found that people who use live streaming and video sites such as "Kick," "Niconico Live Broadcast," "Twitch," "Niconico Video," and "YouTube Live" tend to spend more than people who use "SNS."
[Intention to use in-app purchases]
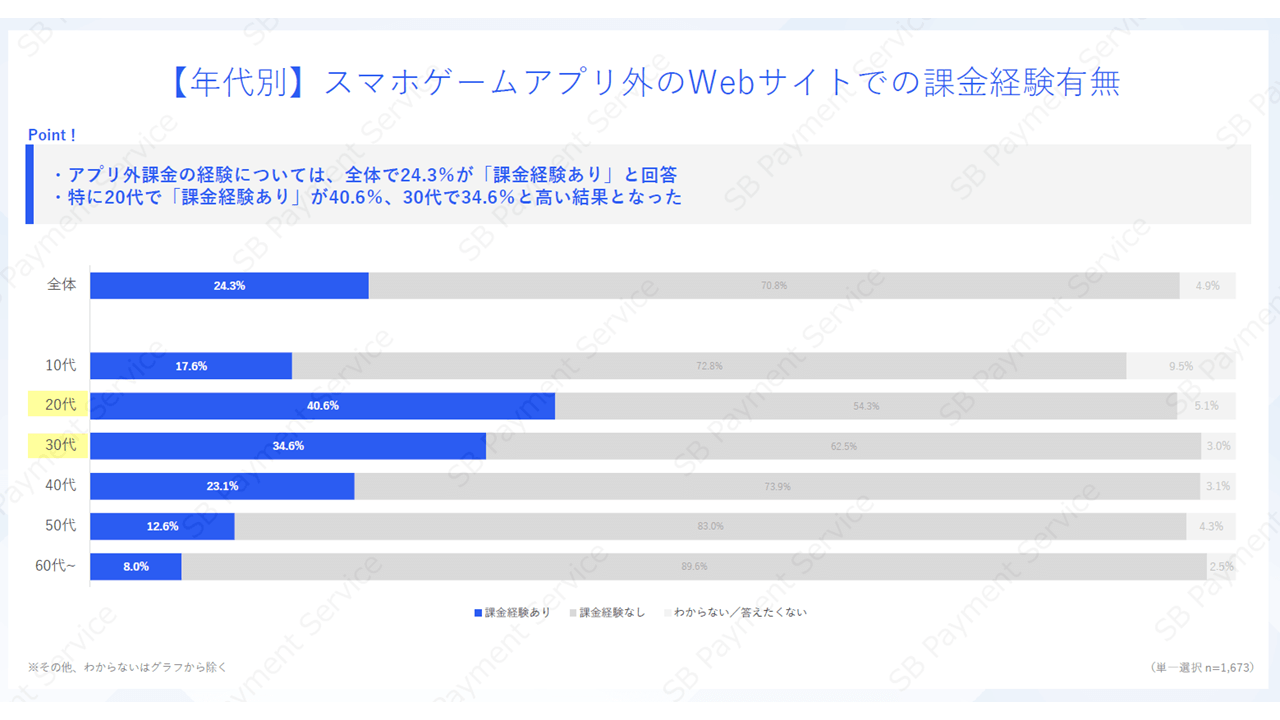
When asked if they had ever purchased items from websites other than smartphone game apps (out-of-app purchases), 24.3% of respondents answered that they had. In particular, those in their 20s (40.6%) and those in their 30s (34.6%) had a higher percentage of experience with out-of-app purchases than other generations.
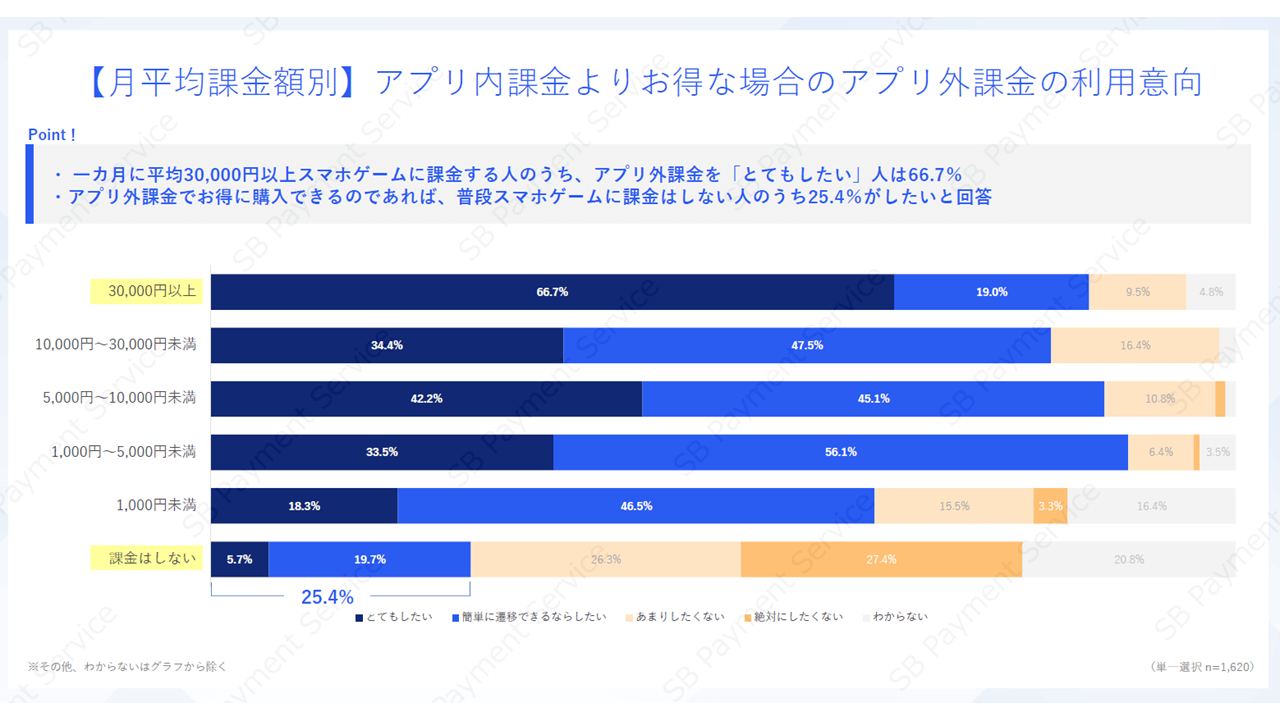
When asked if they would be willing to make purchases if in-app purchases were more cost-effective than in-app purchases, 66.7% of people who spend over 30,000 yen a month answered "I would definitely want to." Even among those who answered that they "don't usually make in-app purchases" for smartphone games, 25.4% showed a positive intention to use them.
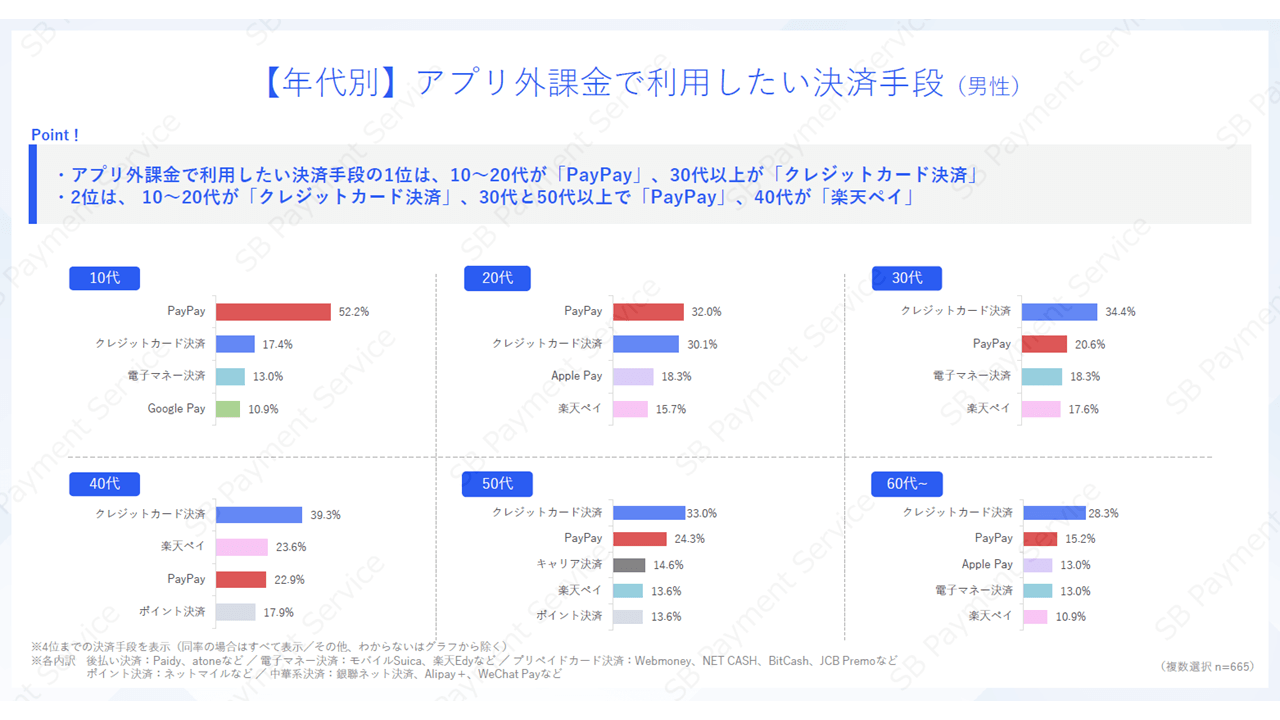
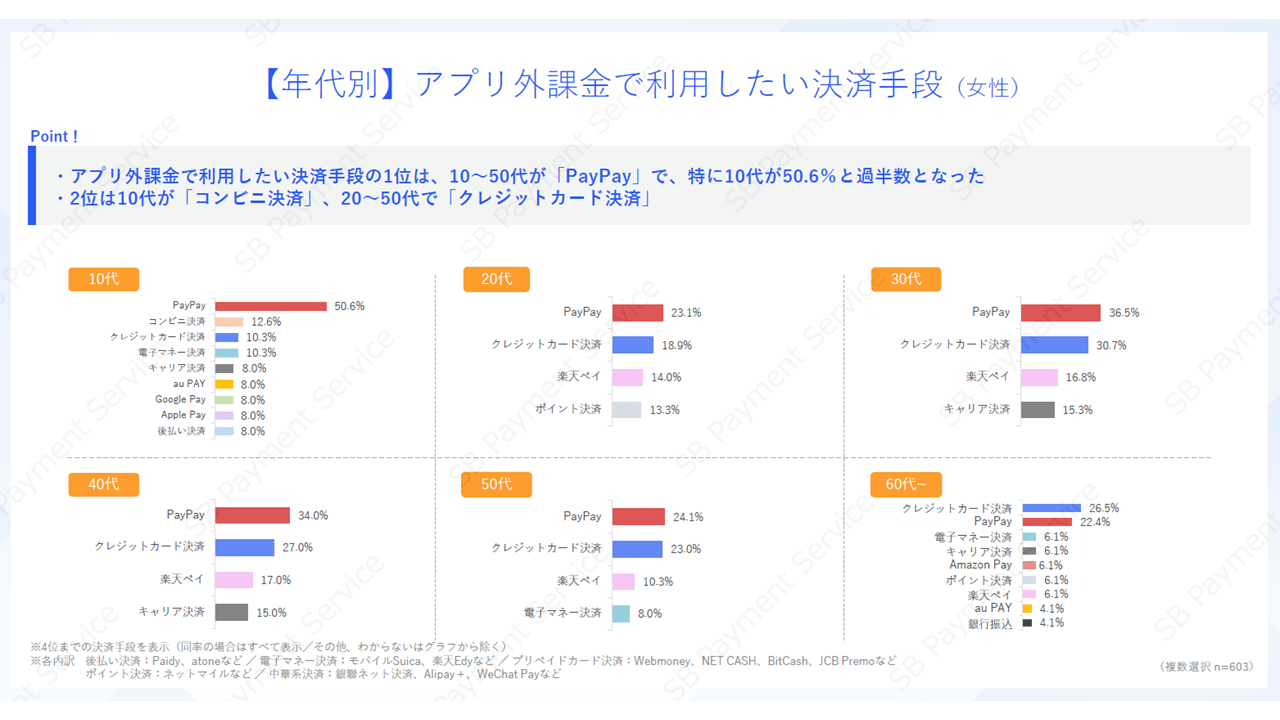
When asked payment methods they would like to use for out-of-app purchases, the top choice was "PayPay" for men in their teens and twenties and women in their teens and fifties, followed by "Credit Card Payment" for men in their thirties and older and women in their sixties and older. In second place was "PayPay" for men in their thirties and older than fifties and women in their sixties and older, "CVS Payment" for women in their teens, "Rakuten Pay" for men in their forties, and "Credit Card Payment" for men in their teens and twenties and women in their twenties and fifties. Over 50.6% of teenagers, both males and females, chose "PayPay," showing how popular it is especially among teenagers.
SB Payment Service Corp. offers a variety of payment services for businesses that sell smartphone game apps, etc. We can help you increase awareness and attract customers by leveraging SoftBank's customer base, and we can also propose ways to improve convenience by expanding your lineup of payment methods, so please feel free to contact SB Payment Service Corp..
Download the full survey results here.
https://www.sbpayment.jp/whitepapers/download/mobilegame.html
Copyright
・You may freely reproduce both the illustrations and text from this survey.
- The copyright of this survey belongs to SB Payment Service Corp., but permission for use is granted to those who meet the following conditions of use.
Terms of Use
1. Clearly state the name of "SB Payment Service Corp." as the source of the information.
2. Provide a link to the following URL as the source.
https://www.sbpayment.jp/news/press/2025/20250514_001447/
3. Use the survey results data without processing or altering it.
4 Comply with requests to remove content that we deem inappropriate.
- Other company names and product/service names mentioned are trademarks or registered trademarks of the respective companies.
Company Profile
SB Payment Service Corp.
| Representative | Jun Shimba, President & CEO |
|---|---|
| Location | 1-7-1 Kaigan, Minato-ku, Tokyo Tokyo Port City Takeshiba Office Tower |
| Established | October 1, 2004 |
| Business content | Payment service, collection agency and corporate calculation office work, acquiring (card merchant business) business, issuing (card issuing business) business |
| URL | https://www.sbpayment.jp/en/gl-top/ |
Inquiries about payment services
SB Payment Service Corp.
| Inquiry form | https://www.sbpayment.jp/en/contact/contact-en/ |
|---|
Inquiries from the media regarding this matter
SB Payment Service Corp. Public Relations
| Inquiry form | https://www.sbpayment.jp/en/contact/contact-en/ |
|---|
- インフォメーション 2026年
- インフォメーション 2025年
- インフォメーション 2024年
- インフォメーション 2023年
- インフォメーション 2022年
- インフォメーション 2021年
- インフォメーション 2020年
- インフォメーション 2019年
- インフォメーション 2018年
- インフォメーション 2017年
- インフォメーション 2016年
- インフォメーション 2015年
- インフォメーション 2014年
- インフォメーション 2013年
- インフォメーション 2012年
- インフォメーション 2011年
- インフォメーション 2010年
- インフォメーション 2009年
- インフォメーション 2008年
- インフォメーション 2007年